
In March 2015, we surveyed adult Texans ages 18 to 64 to assess affordability and utilization of health care services by insured and uninsured Texans. Texas has made strong gains in coverage since the opening of the Marketplace in January 2014, and research by the Urban Institute suggests that coverage gains will increase access to and reduce the costs of health care for those who have gained coverage. We also examined self-reported health status for insured and uninsured Texans.
Our results showed that those without coverage had more trouble paying medical bills than those with insurance and that they also skipped care due to costs more so than those with insurance. Self-reported health status was similar for the two groups regarding physical health, but uninsured respondents reported more days of poor mental health than the insured respondents.
About the Survey
The Health Reform Monitoring Survey (HRMS) is a quarterly survey of adults ages 18-64 that began in 2013. It is designed to provide timely information on implementation issues under the ACA and to document changes in health insurance coverage and related health outcomes. HRMS provides quarterly data on health insurance coverage, access, use of health care, health care affordability, and self-reported health status. The HRMS was developed by the Urban Institute, conducted by GfK, and jointly funded by the Robert Wood Johnson Foundation, the Ford Foundation, and the Urban Institute. Rice University’s Baker Institute and The Episcopal Health Foundation are partnering to fund and report on key factors about Texans obtained from an expanded, representative sample of Texas residents (HRMS-Texas). The analyses and conclusions based on HRMS-Texas are those of the authors and do not represent the view of the Urban Institute, the Robert Wood Johnson Foundation or the Ford Foundation. Information about the sample demographics of the cohort is available in. This Issue Brief is a summary of data extracted from the HRMS Survey in Texas that was administered in March 2015. We will continue to report on survey data through additional Issue Briefs and future surveys.
Affordability and Utilization of Care
As we reported in Issue Brief #11, from September 2013 to March 2015, Texas experienced an overall reduction in the rate of uninsured residents ages 18-64 of 7.7 percentage points, from 24.6% to 16.9% (a 31% decrease in the number of uninsured from Sept 2013 to March 2015). In March 2015, we surveyed adult Texans to understand the differences, if any, of insurance status on the ability to afford and access care.
Figure 1 — Adult Texans Reporting Problems Paying for Care
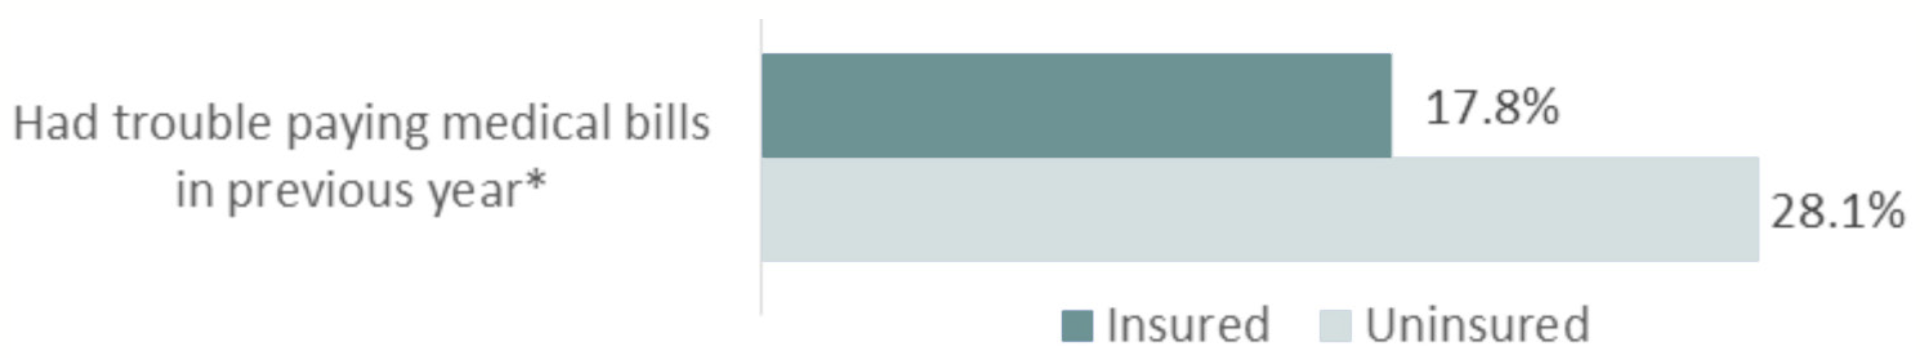
Figure 1 shows that the uninsured were almost twice as likely to have trouble paying medical bills compared to those with coverage. This difference is not surprising, as lack of health insurance is known to be a major barrier to affordability of care. The experience of Texans is similar to that of all Americans, with 15.1% of insured and 25.1% of uninsured reporting difficulties paying medical bills in the last year.
With regard to access to care, both insured and uninsured respondents reported that they had skipped care in the past 12 months because of costs. As shown in Figure 2, for every kind of health service, the uninsured reported having foregone care at significantly higher rates than those who were insured.
Figure 2 — Adult Texans Who Skipped Care Due to Costs
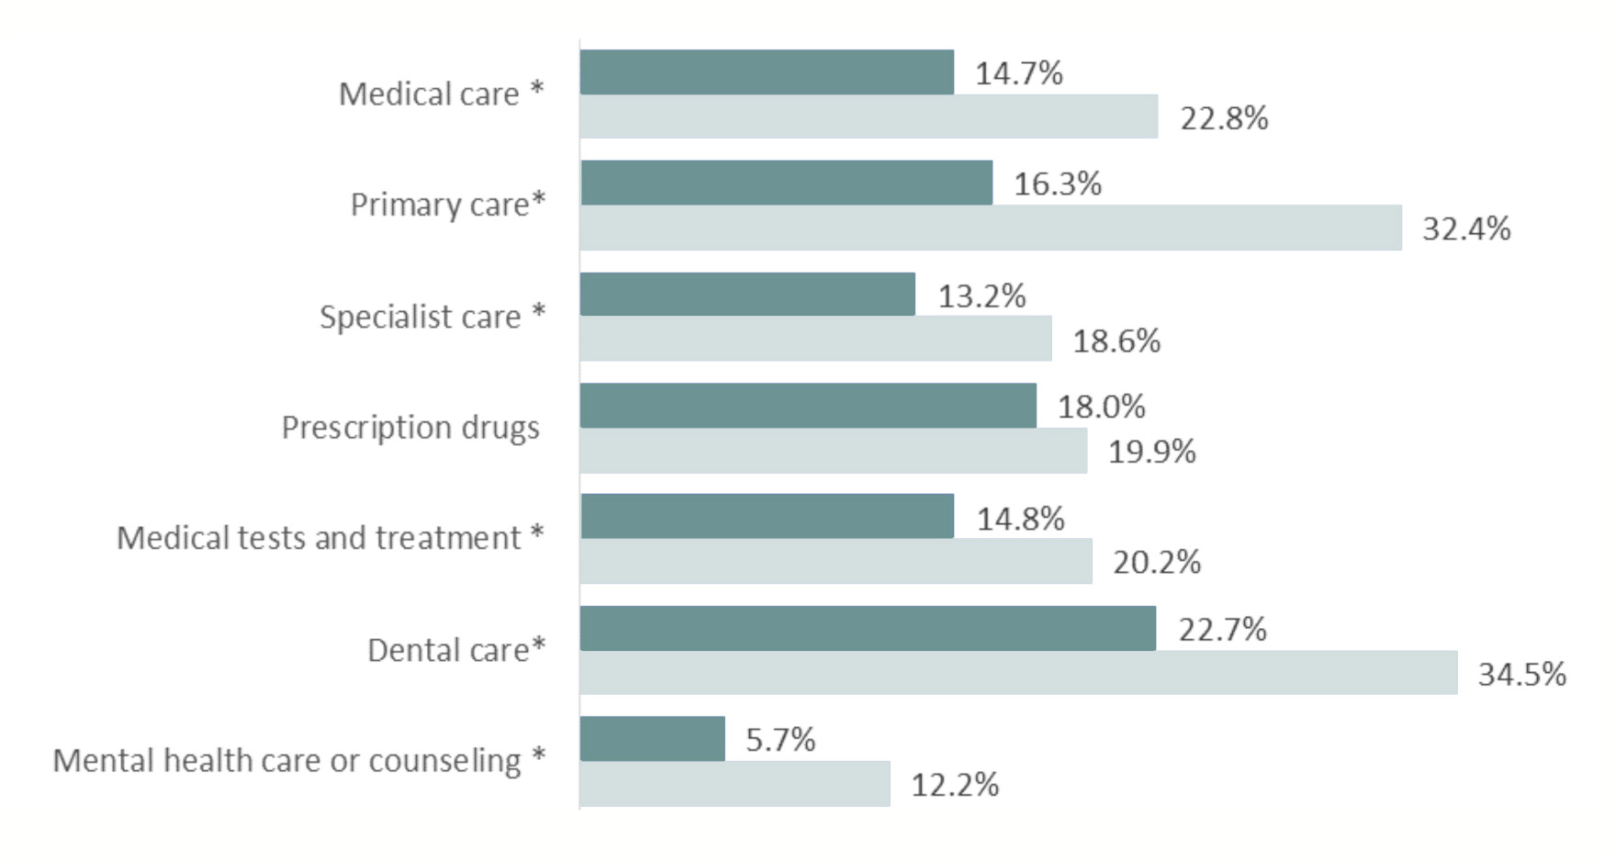
The biggest differences in foregoing services between insured and uninsured respondents are in mental health and primary care, where the uninsured were twice as likely to forego care. Untreated mental illness is associated with numerous adverse outcomes, including physical illness. In the case of foregone primary care, the uninsured may be waiting to seek care until they are sicker and need more intensive and expensive care. This is of concern because primary care is the setting in which less expensive preventive and basic health care services are often provided. Lack of access to affordable mental health and primary care services are well-documented problems for all Texans, especially the uninsured.
Both insured and uninsured respondents were most likely to forego dental care. This is not surprising because most insurance plans to do not include coverage for dental care (the ACA does not require its inclusion in Marketplace plans) and, as with other services, the lack of insurance coverage is associated with skipping care.
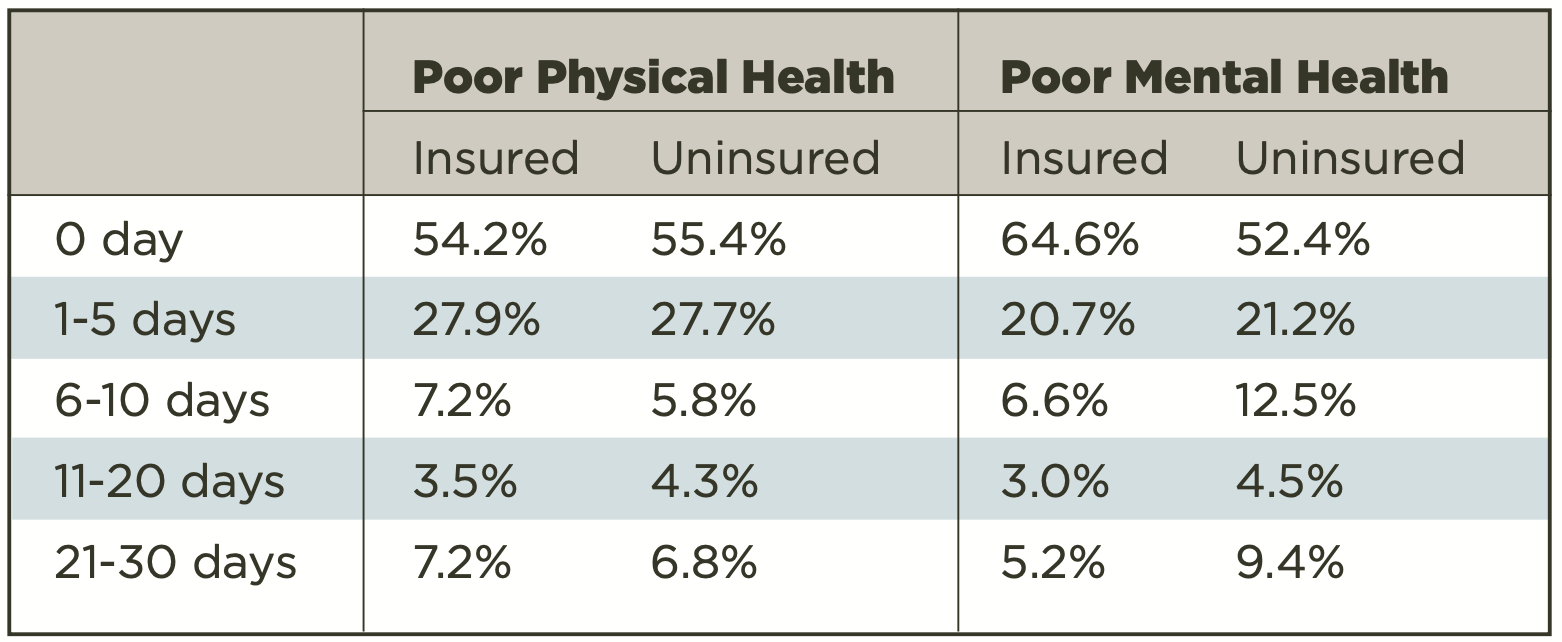
We also compared the health status of insured and uninsured respondents by looking at the number of days of poor physical and mental health reported by each group. As shown in Figure 3, the majority of both groups reported that they had experienced no days of poor physical or mental health in the previous month. Both insured and uninsured respondents reported instances of poor physical health (11 or more days) at similar percentages; however, more uninsured reported 11 or more days of poor mental health (13.9%) compared to the insured respondents (8.2%).
Figure 3 — Self-reported Number of Days of Physical or Mental Illness Within the Last 30 Days
Looking Ahead
In our next brief, we will continue to explore the March 2015 survey responses. We will obtain another survey in September, which will reflect insurance status after the close of the second enrollment period and the special enrollment period afforded to some Americans in 2015.
Methodology
Each quarter’s HRMS sample of nonelderly adults is drawn from active KnowledgePanel® members to be representative of the US population. In the first quarter of 2013, the HRMS provided an analysis sample of about 3,000 nonelderly (age 18–64) adults. After that, the HRMS sample was expanded to provide analysis samples of roughly 7,500 nonelderly adults, with oversamples added to better track low-income adults and adults in selected state groups based on (1) the potential for gains in insurance coverage in the state under the ACA (as estimated by the Urban Institute’s microsimulation model) and (2) states of specific interest to the HRMS funders.
Although fresh samples are drawn each quarter, the same individuals may be selected for different rounds of the survey. Because each panel member has a unique identifier, it is possible to control for the overlap in samples across quarters.
For surveys based on Internet panels, the overall response rate incorporates the survey completion rate as well as the rates of panel recruitment and panel participation over time. The American Association for Public Opinion Research (AAPOR) cumulative response rate for the HRMS is the product of the panel household recruitment rate, the panel household profile rate, and the HRMS completion rate—roughly 5 percent each quarter.
While low, this response rate does not necessarily imply inaccurate estimates; a survey with a low response rate can still be representative of the sample population, although the risk of nonresponse bias is, of course, higher.
All tabulations from the HRMS are based on weighted estimates. The HRMS weights reflect the probability of sample selection from the KnowledgePanel® and post-stratification to the characteristics of nonelderly adults and children in the United States based on benchmarks from the Current Population Survey and the Pew Hispanic Center Survey. Because the KnowledgePanel® collects in-depth information on panel members, the post-stratification weights can be based on a rich set of measures, including gender, age, race/ethnicity, education, household income, homeownership, Internet access, primary language (English/Spanish), residence in a metropolitan area, and region. Given the many potential sources of bias in survey data in general, and in data from Internet-based surveys in particular, the survey weights for the HRMS likely reduce, but do not eliminate, potential biases.
The design effect for the Texas data in March 2015 is 2.184 and the MOE is +/- 3.7. The survey fielded from March 5-30.


